
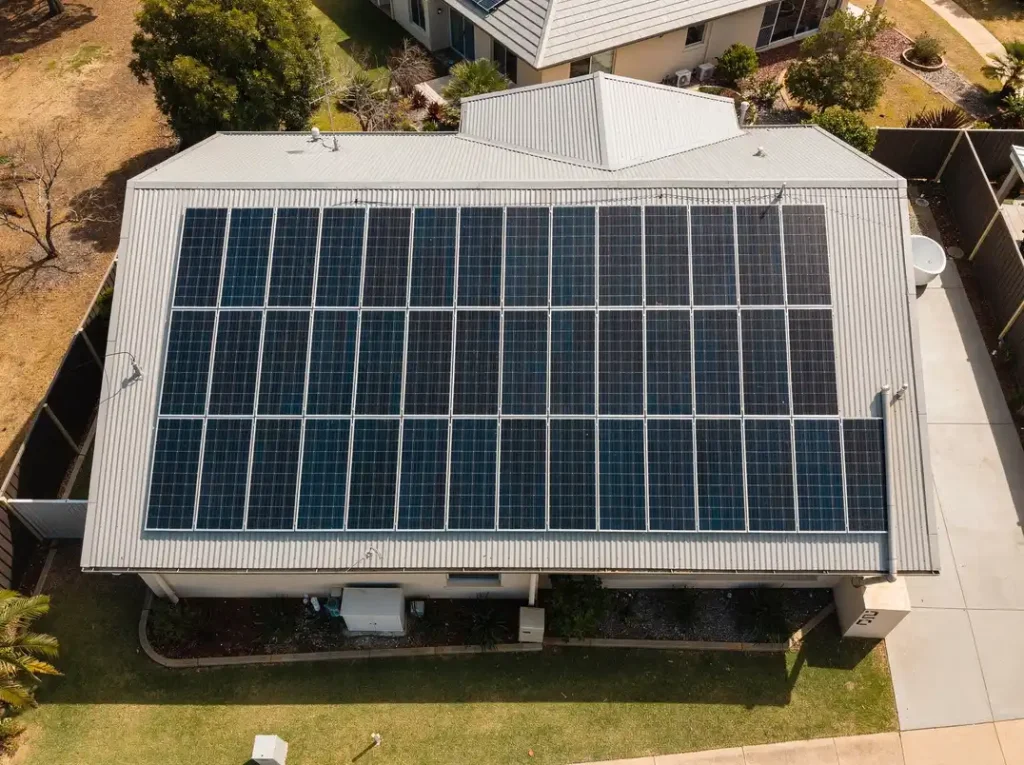
Many Perth homeowners assume the job is finished the moment the panels are bolted to the roof and the system switches on. In reality, that switch-on is where a new habit begins. Ongoing monitoring is what protects the investment, and reputable installers design solar power systems with monitoring in mind so you can actually see what your panels are doing day to day. If you’ve recently reached activation after the wait between enquiry and switch-on, this guide picks up the story from there.
Prefer to watch or listen?
Understanding Your Monitoring Platform
Almost every modern system comes with a monitoring app or web portal linked to your inverter. This is your window into how the system performs. Spend a few minutes learning where the key figures live, because that familiarity makes everything else easier.
Most platforms show production over three timeframes:
- Daily – a live curve that rises through the morning, peaks around midday and tapers off in the afternoon.
- Monthly – a bar chart that reveals seasonal patterns and lets you compare one month against another.
- Lifetime – the running total since activation, useful for tracking long-term performance.
A healthy daily curve looks like a smooth bell shape on a clear day. Sharp dips in the middle of a sunny day can point to shading, dirt or a fault worth investigating.
Key Metrics Worth Tracking for a Perth Home
You don’t need to track everything, but a handful of numbers tell you most of what matters.
- kWh generated – the total energy your panels produce. This is the headline figure and the easiest to sanity-check against expectations.
- Self-consumption – how much of that energy your home uses directly. The more you use on site, the more you offset from your bill.
- Grid export – the surplus you send back to the network. Understanding your split between self-consumption and export helps you shift usage to daylight hours.
Perth’s strong sunshine means summer output is typically high, with long days and intense light. Winter naturally produces less because days are shorter and the sun sits lower. Seeing that seasonal swing in your app is normal and expected – it’s the pattern within each season that tells you whether something is off.
Interpreting Inverter Status Indicators
Your inverter is the heart of the system, and its status lights are the quickest health check available without opening an app. Most units use a simple colour code.
- Green – the system is operating normally and generating power.
- Orange or amber – often a standby or warning state, which may resolve on its own or point to a communication issue.
- Red or flashing – a fault the system cannot clear itself, usually paired with an error code.
If you see a fault code, note it down and check your monitoring app, which often explains the message in plain language. A brief overnight shutdown is normal because inverters power down when there’s no sunlight. A persistent red light during daylight hours is worth acting on.
Spotting Underperformance Early
The most valuable monitoring skill is comparing what your system actually produces against what it should produce. Your installer can give you a rough expected daily and annual generation figure based on your system size, roof orientation and tilt.
North-facing panels generally produce the most across the day in Perth. East and west orientations shift the peak earlier or later. Once you know your expected output, a consistent shortfall of, say, 15 to 20 percent on clear days is a signal to look closer. One cloudy week is not – weather causes plenty of normal variation.
Keep a loose record. If July this year is well below July last year with similar weather, that comparison is far more telling than any single day.
Simple Seasonal and Maintenance Checks
Perth throws two challenges at solar panels: dust through the dry months and storms through winter. Both can affect output, and both are easy to stay ahead of.
- Rinse or arrange cleaning after long dry, dusty stretches, especially if panels sit at a low tilt where grime builds up.
- After a big storm, glance at your app to confirm the system restarted and is generating as expected.
- Watch for new shading from growing trees or nearby construction that wasn’t there at installation.
- Check that the inverter area stays clear, dry and well ventilated.
A quick seasonal look-over takes minutes and keeps small issues from quietly eroding your savings.
When a Dip Is Normal and When to Call Your Installer
Not every drop in production is a problem. Cloud cover, shorter winter days, dust and a hot day that nudges panel efficiency down are all routine. These dips tend to be gradual, weather-linked and self-correcting.
Contact your installer when the picture doesn’t add up: a persistent inverter fault, a sudden and unexplained drop in output on clear days, one part of the array producing far less than the rest, or production that stays flat despite bright conditions. A short call with the people who designed your system usually pinpoints the cause quickly.
Once you can see real production and savings data flowing in, many homeowners start looking harder at the full economics of their system – including the upfront incentives that reduced what they paid at the outset. Understanding the government rebate applied at the point of purchase helps you appreciate the complete return your monitored system is delivering, and it’s a natural next step in getting the full financial picture.